There are many ways possible ways to collect logspace usage data from SQL Server – this was a quick way using the tools I had at hand – DBCC, perl, elastic search and kibana.
All I did was capture the output of:
DBCC SQLPERF(logspace)
into a temporary table using a simple perl script using DBI. I then did a SELECT against the temporary table in the same perl script and posted the resulting data into ES using the Search::Elasticsearch CPAN module. The ES index was very simple – just 4 columns: database, logspace, logspaceused (%) and the timestamp of the capture (GETDATE()).
After that, all I had to do was visualize the data using Kibana. Here’s some sample output:
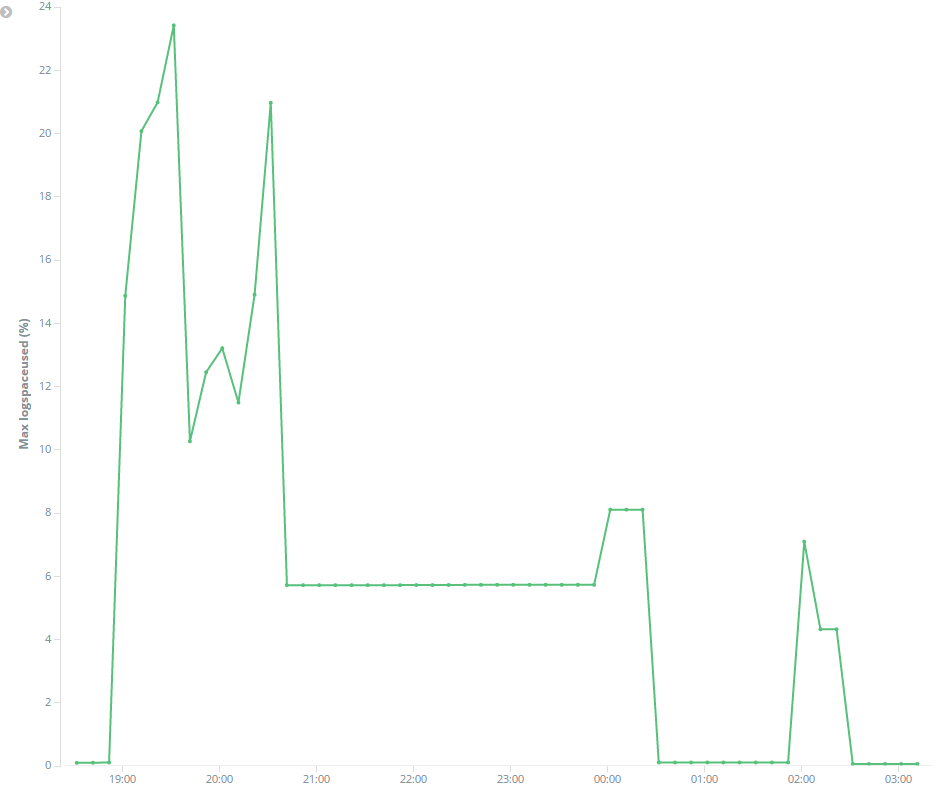
A great way to see the log space pressure points which can easily be tied back to specific batch processes at those times.